This content was presented to Nelson\Nygaard Staff for the Shiny Webinar series on Wednesday, September 23rd, 2020, and is available as a recording here and is embedded below.
Today’s Agenda
Application Deployment
Up to this point, you have only run your Shiny apps locally in RStudio, but obviously one of the best parts about Shiny apps is sharing them with others! Shiny can be hosted on a private server computer, like a personal or company server, or – as is more common – can be hosted on a cloud computing service like Amazon Web Services (AWS). However, the easiest way we have found to host Shiny apps is through a service provided by RStudio – shinyapps.io – that enables applications to be bundled and uploaded directly through the RStudio desktop software. RStudio offers some nice features that you wouldn’t get out of the box on a private server, like a performance dashboard, a log history, user authentication, load balancing, and others (some I am sure I am not aware of). Nelson\Nygaard has a paid account with shinyapps.io that lets us upload basically as many applications as we want that we can set up as public or private (i.e. with authentication). There will be an upper limit on the number of applications we can deploy when we hit 2,080 active hours per month, but as of this writing we are averaging under 90 active hours per month – less than 5% of our capacity – so there is basically no marginal cost to the addition of new applications at this point. If we get to the point of meeting this threshold, we can upgrade our server to handle more active hours per month – this will mean we’re using Shiny to serve a lot of clients!
For now, all you will need to know is how to deploy applications to NN’s Shiny server. There is an admin dashboard we’re limiting access to for now to a small group, but will give deployment access to all those in this course using a private token. I will share the private token with folks in the private Slack channel for the Shiny course module. This token must not be shared outside this group, and should live in the private Slack channel for now. It is likely we will create a private Slack channel for users going forward where this can be stored. There is the potential to create multiple tokens, which is something we may explore in the future.
Bryan will now share his screen to walk through a sample deployment of the application we will be focusing on today. If you are viewing this after the fact, the sample application Bryan will be deploying is stored in the GitHub repository at this subfolder.
Example Application
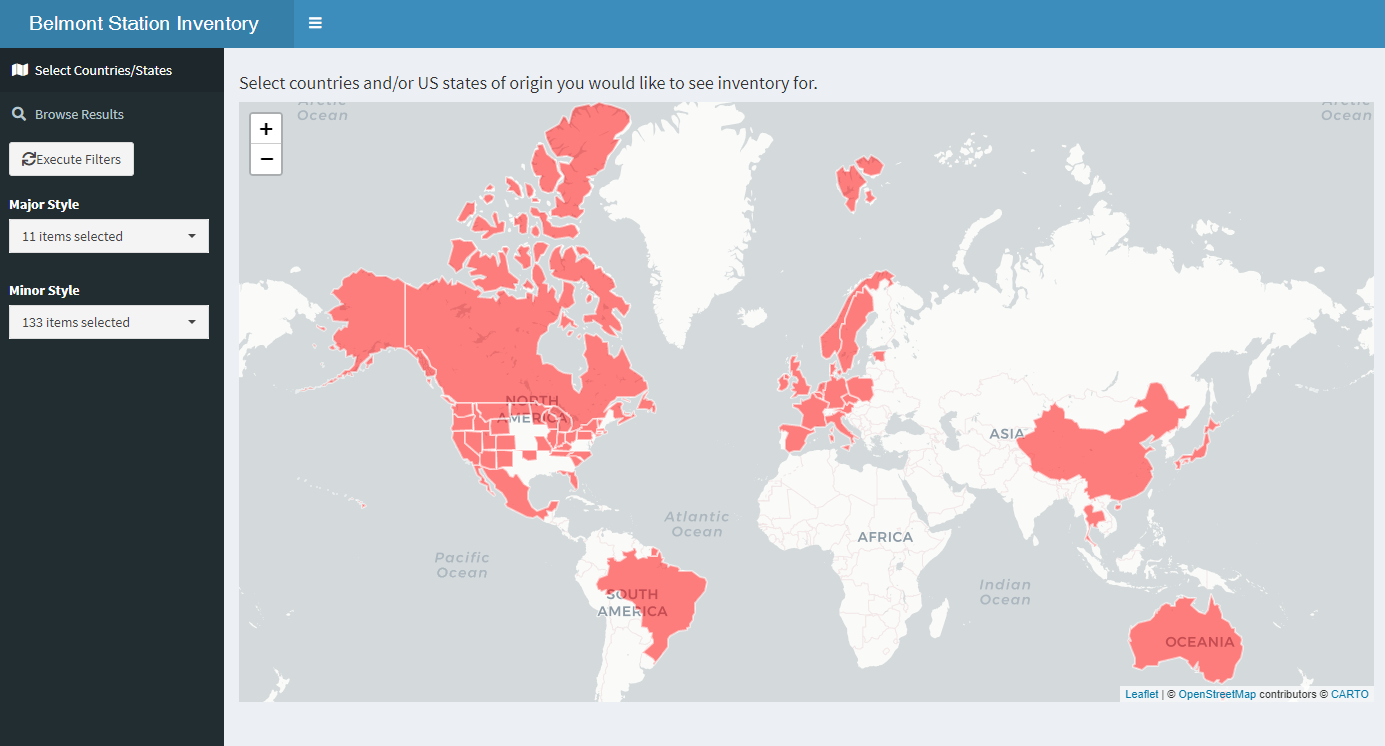
This is an application I built in a few hours this morning to demonstrate some of the more complex capabilities that I think people will want to use in their applications. The example application is deployed on shinyapps.io here. To have a bit of fun with the example and still cover the capabilities I wanted to show, I decided to scrape the beverage (mostly beer) inventory that Belmont Station (a local bottle shop in Portland, OR) updates on their website each day. That means if you are looking at it on different days, the results will look slightly different (based on their live inventory). I will walk through the entire application itself, but will try to highlight some key pieces below.
User Feedback
For many Shiny applications, you will want to be able to broadcast information to the user about what is going on behind the scenes. In this application, I used a couple different items to broadcast feedback to the user:
- Changing Button Color: You will see throughout the code that I am changing the ‘Execute Filters’ button color (and whether it is able to be pressed) based on processes under the hood to both prevent errors and speed up the application. There are two instances where I don’t want the user to press the button:
- When data is being scraped: Because the application is based on live data, the data from Belmont Station must first be scraped when the application starts up. While this is going on, I don’t want the user to press the button because my select pickers (for beer styles) are not ready yet. I both color the button to send the user a message and I disable it from being pressed. This message is reinforced by the progress bar.
- Order of operations: Because Shiny apps operate in parallel (to increase overall speed), there are instances where a process will finish, but you need another process to finish before you can move on to the next one. To be less abstract, the web scraping finishes before the select pickers are updated, and there are a few seconds where I still want to prevent the user from pressing the button (because there are no styles in the select pickers to draw from). In this case, I use a notification to tell the user to hold on a moment while the select pickers are updated, if they happen to press the button before they are populated.
- Progress bars: I use progress bars throughout the app to send a message that something is happening under the hood, and the user just needs to be patient for a moment. These can be used more precisely than I have – if you have an estimate on time it takes to run a specific chunk of the code, you can adjust the percentage progress indicators accordingly. In this case, I just want to reassure the user that their inputs have been received and things are happening.
- Updating selection widgets: Sometimes, you will have selections that affect each other. In this case, I only want to show major and minor styles that have not been affected by other selections – i.e. if a major style is removed from the selection set, we should deselect the minor styles that fall under that major style. Additionally, if geographies have been deselected, styles that only appear in those geographies should be deselected as well. While this is not neccessary for the app to operate – the filters will operate correctly whether those items were properly deselected or not – this is helpful to show the user how one selection is impacting another.
- Showing a Notification: As referenced above, I show a notification when I don’t want the user to hit the execute button until the select pickers have been populated. This helps to ward off errors but relay what is going on to the user.
- Leaflet Highlight Options and Colors: I am also using leaflet’s highlight options and colors to help the user know which geographies they are hovering over and which geographies have been selected or deselected. I will discuss in more detail below how colors are used in tandem with layer IDs to show the selection set.
Map Interactivity
I talked in an earlier session about the use of maps for selection. This can get a bit complicated, but it is hopefully well demonstrated in this application. In general, I would review the relevant documentation before trying to do this in your application. Items to note from the application include:
- Leaflet Proxies: I am not rendering a new leaflet map each time something changes – instead I am passing the changes to the original map using a
leafletProxy(). This is well documented in the leaflet/Shiny article referenced above. - Layer IDs: To use maps as a selection tool, each one of your geometries will need a unique layer ID so it can be appropriately referenced throughout the selection process.
- Global scoping: You will see for the geography selection I use the global assignment operator
<<-– this is neccessary because the selection set is referenced across multiple scopes. In a shiny app, a new scope is created for eachexprargument you are handing to a reactive function, likeobserveEvent(). Each one of these reactive functions has a separate scope, so if you want to share objects across those scopes, those objects must be assigned globally. For more on scoping, I would recommend reading this book chapter - Removing and Adding Shapes: Using the layer ID referenced above, you can remove and add back a specific shape, which allows you to change that shape’s color. We are only doing this with one shape at a time because of the use of our layer IDs, which we have from a global selection set.
Data Tables
I glossed over the use of DataTables in a previous session – they are great for presenting tabular data to the user in a user-friendly manner. They allow for sorting, searching, scrolling, paginating (though I don’t use that here), filtering, and have many other features including custom colors and fonts. Full documentation for the DataTable package is provided here.
This content was presented to Nelson\Nygaard Staff for the Shiny Webinar series on Wednesday, September 23rd, 2020, and is available as a recording here and is embedded at the top of the page.